Go语言性能分析
当go语言运行过程中,出现了内存泄露,或者基准测试无法达到预期的性能时,就需要对golang进行性能分析。
go语言的提供了非常好用的性能采样与分析工具。
数据采样
go test提供了测试运行时数据采样参数(详见:
Go语言单元测试非常规操作
),可以对测试用例执行过程中的数据进行采样。同时,golang的pprof包提供了丰富的运行时采样接口。
CPU概要采样
pprof.StartCPUProfile(w Writer)
defer pprof.StopCPUProfile()
StartCPUProfile在被调用的时候,先会去设定 CPU 概要信息的采样频率,并会在单独的goroutine中进行CPU概要信息的收集和输出。StartCPUProfile函数设定的采样频率为每秒采样100次。
堆内存概要采样
runtime.MemProfileRate = 8
defer pprof.WriteHeapProfile(w Writer)
runtime.MemProfileRate设定内存概要信息采样频率,代表每分配多少个字节,就对堆内存的使用情况进行一次采样。
pprof.WriteHeapProfile将收集好的内存概要信息写入到写入器中。这里写入的信息不是实时信息。
阻塞概要采样
runtime.SetBlockProfileRate(rate int)
blockpprof := pprof.Lookup("block")
blockpprof.WriteTo(w io.Writer, debug int)
runtime.SetBlockProfileRate(rate int)设置阻塞概要信息采样的频率,入参的rate有点歧义(个人观点),这个参数的含义是如果一个阻塞事件的持续时间达到了多少纳秒,就对其进行采样。这个参数的值小于或等于0时,则停止对阻塞采样。
pprof.Lookup("block")中的参数是固定值,这里的输入参数还可以是
"goroutine": goroutine"threadcreate": 线程创建(不确定是否是内核线程的创建)"heap": 堆内存"allocs": 内存分配"block": 阻塞"mutex": 锁
Mutex事件采样
runtime.SetMutexProfileFraction(rate int)
mutexpprof := pprof.Lookup("mutex")
mutexpprof.WriteTo(mutexProfile, 0)
runtime.SetMutexProfileFraction(rate int)这个函数的注释看的不是很明白,原文放在下面了。大致行为和runtime.SetBlockProfileRate差不多。
func SetMutexProfileFraction(rate int) int
    SetMutexProfileFraction controls the fraction of mutex contention events
    that are reported in the mutex profile. On average 1/rate events are
    reported. The previous rate is returned.

    To turn off profiling entirely, pass rate 0. To just read the current rate,
    pass rate < 0. (For n>1 the details of sampling may change.)
其它采样
//goroutine
goroutinepprof := pprof.Lookup("goroutine")
goroutinepprof.WriteTo(goroutineProfile, 0)

//threadcreate
tcpprof := pprof.Lookup("threadcreate")
tcpprof.WriteTo(threadProfile, 0)

//allocs
allocspprof := pprof.Lookup("allocs")
allocspprof.WriteTo(allocsProfile, 0)

//trace
trace.Start(traceProfile)
trace.Stop()
http服务采样
使用go原生的http服务时,import内置的监测包即可通过http服务查看采样数据。
import(
    _ "net/http/pprof"
)
在服务启动时,访问https://ip:port/debug/pprof即可看到采样数据。
数据可视化
go tool pprof和go tool trace可以分析程序运行时的采样数据,也可以通过web浏览器以图形的形式更直观的查看和分析。
安装graphviz
如果只在命令行查看数据,不需要安装
graphviz,但是如果要生成图片,或者web查看数据,则需要安装。
下载地址: http://graphviz.org/download/
安装之后,将bin目录配置到PATH环境变量。
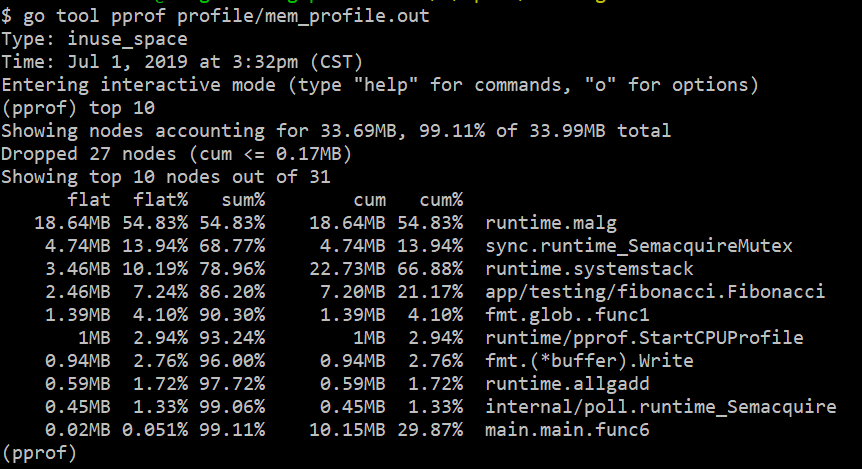
命令命令行查看数据
go tool pprof file_name
go tool pprof https://ip:port/debug/pprof/heap
命令会打开一个交互式命令行,可以输入指令,过滤或者显示相应内容。支持的命令如下
(pprof) help
  Commands:
    callgrind        Outputs a graph in callgrind format
    comments         Output all profile comments
    disasm           Output assembly listings annotated with samples
    dot              Outputs a graph in DOT format
    eog              Visualize graph through eog
    evince           Visualize graph through evince
    gif              Outputs a graph image in GIF format
    gv               Visualize graph through gv
    kcachegrind      Visualize report in KCachegrind
    list             Output annotated source for functions matching regexp
    pdf              Outputs a graph in PDF format
    peek             Output callers/callees of functions matching regexp
    png              Outputs a graph image in PNG format
    proto            Outputs the profile in compressed protobuf format
    ps               Outputs a graph in PS format
    raw              Outputs a text representation of the raw profile
    svg              Outputs a graph in SVG format
    tags             Outputs all tags in the profile
    text             Outputs top entries in text form
    top              Outputs top entries in text form
    topproto         Outputs top entries in compressed protobuf format
    traces           Outputs all profile samples in text form
    tree             Outputs a text rendering of call graph
    web              Visualize graph through web browser
    weblist          Display annotated source in a web browser
    o/options        List options and their current values
    quit/exit/^D     Exit pprof

  Options:
    call_tree        Create a context-sensitive call tree
    compact_labels   Show minimal headers
    divide_by        Ratio to divide all samples before visualization
    drop_negative    Ignore negative differences
    edgefraction     Hide edges below <f>*total
    focus            Restricts to samples going through a node matching regexp
    hide             Skips nodes matching regexp
    ignore           Skips paths going through any nodes matching regexp
    mean             Average sample value over first value (count)
    nodecount        Max number of nodes to show
    nodefraction     Hide nodes below <f>*total
    noinlines        Ignore inlines.
    normalize        Scales profile based on the base profile.
    output           Output filename for file-based outputs
    prune_from       Drops any functions below the matched frame.
    relative_percentages Show percentages relative to focused subgraph
    sample_index     Sample value to report (0-based index or name)
    show             Only show nodes matching regexp
    show_from        Drops functions above the highest matched frame.
    source_path      Search path for source files
    tagfocus         Restricts to samples with tags in range or matched by regexp
    taghide          Skip tags matching this regexp
    tagignore        Discard samples with tags in range or matched by regexp
    tagshow          Only consider tags matching this regexp
    trim             Honor nodefraction/edgefraction/nodecount defaults
    trim_path        Path to trim from source paths before search
    unit             Measurement units to display

  Option groups (only set one per group):
    cumulative
      cum              Sort entries based on cumulative weight
      flat             Sort entries based on own weight
    granularity
      addresses        Aggregate at the address level.
      filefunctions    Aggregate at the function level.
      files            Aggregate at the file level.
      functions        Aggregate at the function level.
      lines            Aggregate at the source code line level.
  :   Clear focus/ignore/hide/tagfocus/tagignore

  type "help <cmd|option>" for more information
常用的命令是top
web可视化
方法1:
在go tool pprof的交互命令行中输入web,将打开一个svg文件,以图形形式展示数据。
方法2:
$ go tool pprof -http=:8080 file_name
$ go tool trace file_name
trace部分页面引用了
https://ajax.googleapis.com/ajax/libs/jquery/3.2.1/jquery.min.js,所以国内需要开代理才能正常显示。
命令会自动打开浏览器,以web页面形式展示数据,图形支持graph(调用关系图)与Flame graph(火焰图),
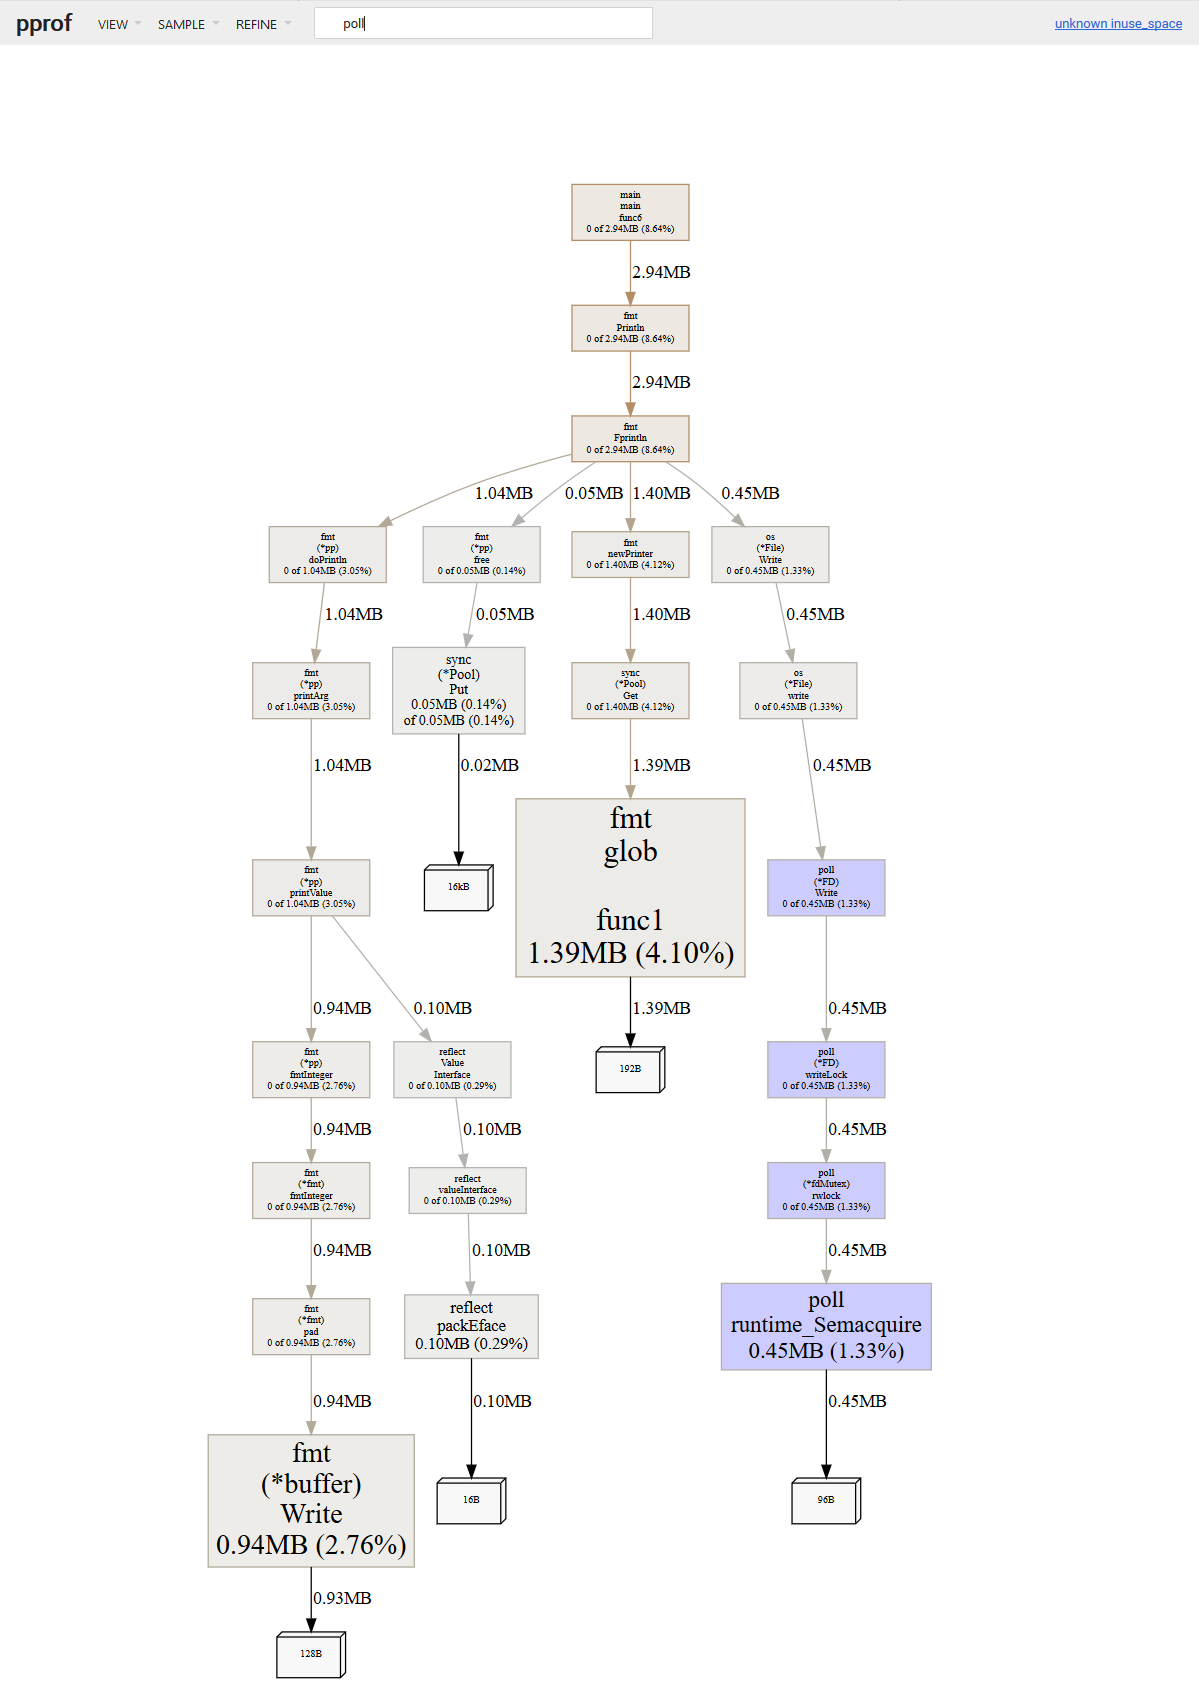
Graph

每个方框代表一个函数,方框的大小和执行时间成正比,箭头代表调用关系。
Flame Graph
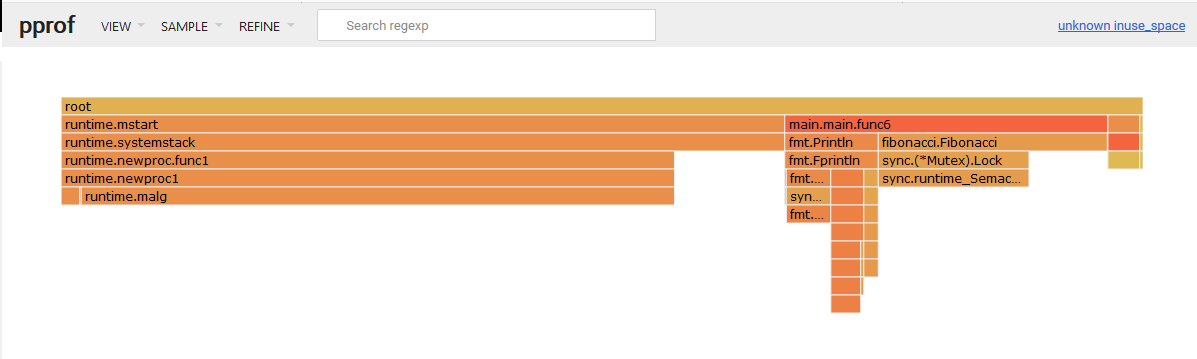
火焰图的Y轴表示调用栈,X轴表示采样数据,X轴宽度越宽,就表示函数在资源占用上较多。这里要注意一点,X轴的数据是调用栈合并后的数据,不是时间维度的调用顺序。
点击函数名时,这一层会被放大,占用所有宽度。
搜索
在web界面的搜索框输入关键词,可以在调用关系图和火焰图上高亮显示匹配的内容。
一个示例
go version
go version go1.12.5 windows/amd64
代码
目录结构
.
|-- fibonacci
|   `-- fibonacci.go
|-- go.mod
|-- go.sum
`-- main.go
go.mod
module app/testing

go 1.12
fibonacci/fibonacci.go
package fibonacci

import (
	"sync"
)

var (
	lock = sync.Mutex{}
)

//Fibonacci 返回n以内的斐波那契数列元素
func Fibonacci(n int64) []int64 {
	lock.Lock()
	defer lock.Unlock()
	result := make([]int64, 0)
	var x, y int64 = 1, 2
	if n >= x {
		result = append(result, x)
	}
	if n >= y {
		result = append(result, y)
	}
	for {
		x, y = y, x+y
		if y >= n {
			break
		}
		result = append(result, y)
	}
	return result
}
main.go
package main

import (
	"app/testing/fibonacci"
	"fmt"
	"log"
	"os"
	"path/filepath"
	"runtime"
	"runtime/pprof"
	"runtime/trace"
	"sync"
)

var (
	profileFolder     = "profile"
	cpuFileName       = "cpu_profile.out"
	memFileName       = "mem_profile.out"
	blockFileName     = "block_profile.out"
	mutexFileName     = "mutex_profile.out"
	goroutineFileName = "goroutine_profile.out"
	threadFileName    = "threadcreate_profile.out"
	allocsFileName    = "allocs_profile.out"
	traceFileName     = "trace_profile.out"
)

func main() {
	var cpuProfile, memProfile, blockProfile, mutexProfile, goroutineProfile, threadProfile, allocsProfile, traceProfile *os.File
	var err error
	//准备CPU概要输出文件
	if cpuProfile, err = CreateOrOpenFile(profileFolder, cpuFileName); err != nil {
		log.Fatalf("CPU profile Open error: %v\n", err)
	}
	defer cpuProfile.Close()

	//准备堆内存概要输出文件
	if memProfile, err = CreateOrOpenFile(profileFolder, memFileName); err != nil {
		log.Fatalf("Memory profile Open error: %v\n", err)
	}
	defer memProfile.Close()

	//准备阻塞概要输出文件
	if blockProfile, err = CreateOrOpenFile(profileFolder, blockFileName); err != nil {
		log.Fatalf("Block profile Open error: %v\n", err)
	}
	defer blockProfile.Close()

	//准备锁概要输出文件
	if mutexProfile, err = CreateOrOpenFile(profileFolder, mutexFileName); err != nil {
		log.Fatalf("Mutex profile Open error: %v\n", err)
	}
	defer mutexProfile.Close()

	//准备goroutine概要输出文件
	if goroutineProfile, err = CreateOrOpenFile(profileFolder, goroutineFileName); err != nil {
		log.Fatalf("gorountine profile Open error: %v\n", err)
	}
	defer goroutineProfile.Close()

	//准备goroutine概要输出文件
	if threadProfile, err = CreateOrOpenFile(profileFolder, threadFileName); err != nil {
		log.Fatalf("threadcreate profile Open error: %v\n", err)
	}
	defer threadProfile.Close()

	//准备内存分配概要输出文件
	if allocsProfile, err = CreateOrOpenFile(profileFolder, allocsFileName); err != nil {
		log.Fatalf("allocs profile Open error: %v\n", err)
	}
	defer allocsProfile.Close()

	//准备trace输出文件
	if traceProfile, err = CreateOrOpenFile(profileFolder, traceFileName); err != nil {
		log.Fatalf("trace File Open error: %v\n", err)
	}
	defer traceProfile.Close()

	//开始CPU采样
	if err := pprof.StartCPUProfile(cpuProfile); err != nil {
		log.Fatalf("CPU profile start error: %v\n", err)
		return
	}
	defer pprof.StopCPUProfile()

	//开始堆内存概要信息采样
	runtime.MemProfileRate = 8
	defer pprof.WriteHeapProfile(memProfile)

	runtime.SetBlockProfileRate(1)
	runtime.SetMutexProfileFraction(1)

	//写入阻塞采样输出
	defer func() {
		blockpprof := pprof.Lookup("block")
		blockpprof.WriteTo(blockProfile, 0)
	}()

	//Mutex 采样输出
	defer func() {
		mutexpprof := pprof.Lookup("mutex")
		mutexpprof.WriteTo(mutexProfile, 0)
	}()

	//goroutine 采样输出
	defer func() {
		goroutinepprof := pprof.Lookup("goroutine")
		goroutinepprof.WriteTo(goroutineProfile, 0)
	}()
	//线程创建 采样输出
	defer func() {
		tcpprof := pprof.Lookup("threadcreate")
		tcpprof.WriteTo(threadProfile, 0)
	}()

	//内存分配输出
	defer func() {
		allocspprof := pprof.Lookup("allocs")
		allocspprof.WriteTo(allocsProfile, 0)
	}()

	//trace输出
	trace.Start(traceProfile)
	defer trace.Stop()

	wg := sync.WaitGroup{}

	for index := 0; index < 100000; index++ {
		wg.Add(1)
		go func(i int) {
			defer wg.Done()
			slist := fibonacci.Fibonacci(int64(i))
			fmt.Println(slist)
		}(index)
	}
	wg.Wait()
}

//CreateOrOpenFile 创建或者打开文件
func CreateOrOpenFile(folder, filename string) (*os.File, error) {
	FilePath := filepath.Join(folder, filename)
	if _, err := os.Stat(FilePath); err != nil {
		if err = os.MkdirAll(folder, 0755); err != nil {
			return nil, err
		}
		return os.Create(FilePath)
	}
	return os.Open(FilePath)
}
构建与运行
$ go build

$ ./testing
程序会在当前目录创建profile目录,并把所有采样数据放在此目录中。采样数据可以使用go tool命令分析。